2-Stage Range Expectancy Widget
The 2-Stage Range Expectancy widget receives live position-sizing and chart data from the MyFxPartner EA in MT4. It then analyses historical MA-cross behaviour for the selected symbol and compares it to your current trade setup. This helps you understand how often similar conditions have produced the extension and target outcomes you are aiming for.
Extension
This gauge shows the percentage of historical MA crosses where price moved higher than the current high during a long-cross phase, before reaching the peak of that cross.
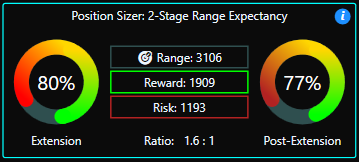
In the example shown, the Extension Gauge reads 80%.
This means that in 80% of past long-cross events on this pair, price pushed above the current high before the cross completed.
Since most entries occur after a pullback, this tells you whether the current cross still has statistical room to extend upward.
Post-Extension
This gauge shows the percentage of historical crosses where price eventually reached the current TP line — but only in cases where price first broke above the current high.
In the example, the Post-Extension Gauge reads 77%.
This means that when price did break the high, it went on to reach the TP level (as currently placed) 77% of the time.
Target Range
This is the number of points between the MA-cross price and your current TP line.
In this example, the TP is positioned 3106 points above the cross.
Reward
This is the number of points you stand to gain if the trade wins — the distance between your entry line and the TP line.
In the example, the entry is 1909 points below the TP.
Risk
This is the number of points between your entry and your stop-loss.
Since Reward is 1909 and the ratio is 1.6:1, the implied risk is 1193 points.
Ratio
This shows your reward-to-risk ratio based on the current placement of your entry, TP, and SL.
In this example, you are targeting 1.6 units of reward for every 1 unit of risk.
NOTE:
The 2-Stage Range Expectancy widget gives you a statistical context for your trade idea.
It does not predict individual trade outcomes, however, it does show how often similar MA-cross setups have extended past the high and how often they have reached your TP level.
Combined with the Position Sizer, it helps you judge whether your entry, TP, and SL placement align with the historical tendencies of the pair you are trading.